After 2 months of silence, my blog shall speak again!
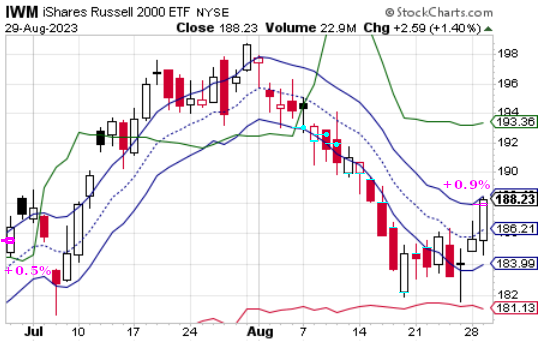
Latest trade was not so hot. The market took too long to get going with
its downswing, so I didn’t have enough buying power left when we got to the
bottom, so I only got +0.9% for all that time and risk (the maximum
drawdown was -9.1% on Aug 25). Still, I managed to walk out of the casino
with a profit even though the cards did not break my way.
From Jul 11 until Aug 03 there was an upswing that I could have traded for a +1.7% gain, but I skipped it because of that green line. One
of these days I have to review the data supporting that line — it seems to
skip too many good trades. But the red line came very close on Aug
25, and I have somewhat more faith in that line, so I think I’ll skip the
contrarian trade on the next downswing. Meanwhile, we’re going up, so I
should start short-selling tomorrow.
2022 Comparison
| Start | +/- | IWM | TNA/TZA |
|---|
| Jan 05 | 🐻 | +0.34% | +0.30% |
| Jan 07 | 🐂 | –1.89% | –2.69% |
| Feb 10 | 🐻 | +1.78% | +1.90% |
| Feb 22 | 🐂 | +1.47% | +1.53% |
| Mar 02 | 🐻 | +0.39% | +0.87% |
| Mar 08 | 🐂 | +0.75% | +1.17% |
| Mar 17 | 🐻 | +2.34% | +5.84% |
| Apr 06 | 🐂 | +3.03% | +3.09% |
| Apr 21 | 🐂 | –8.29% | –10.78% |
| Apr 21 | 🐻 | — | +0.38% |
| May 27 | 🐻 | +5.71% | +5.14% |
| Jun 13 | 🐂 | +6.92% | +7.20% |
| Jun 30 | 🐂 | +1.27% | +1.35% |
| Jul 08 | 🐻 | +0.39% | +0.40% |
| Jul 14 | 🐂 | +0.78% | +0.41% |
| Jul 19 | 🐻 | –3.49% | –5.53% |
| Aug 22 | 🐂 | +5.84% | +6.25% |
| Oct 04 | 🐻 | +1.04% | +1.11% |
| Oct 14 | 🐻 | +5.96% | +7.27% |
| Nov 09 | 🐂 | +0.37% | — |
| Dec 05 | 🐂 | +2.77% | +3.04% |
| Dec 15 | 🐂 | +4.23% | +4.17% |
|
| TOTAL | | 31.71% | 32.42% |
On Jun 25 I
wrote, “I also
don’t account for interest on cash balances (over 4½% now at IB!), margin
interest (7½%), nor the fee for borrowing shares (¼% per day, so 62½%
annualized)… a short trade that drags on for a month would yield
significantly less than my charts are showing. Perhaps some
improvement in simulation accuracy is warranted.” Years ago, I used to
trade TNA and TZA in an IRA account, instead of
doing IWM in a margin account as shown here. Those tickers are
basically pre-packaged short-selling/trading on margin, with insurance
against losing more than 100%. Everyone says those fees and insurance are
very expensive and surely it would be better to borrow from your own
broker? If I had used TNA for the trade-set that ended today, the
profit would have been only +0.5%, not +0.9%.
Let’s review the trading for 2022, comparing the use of IWM (🐂
long on margin, 🐻 short borrowed shares) vs. TNA (3× 🐂)
or TZA (3× 🐻) for each trade-set. So instead of betting 300% of my money on IWM, I would bet 100% on TNA.
Bottom line up front: it’s a wash. Using TNA/TZA (with
prepackaged fees) gives roughly the same results as using IWM and
imagining that there won’t be any fees. So it seems that, if I ever try
this with real money again, I should either use TNA/TZA or demand
that my broker beat their effective cost.
The two approaches mostly trade on the same days, but TNA/TZA trades
more often because the ±0.75⋆ATR prices that I look for come up more often
on these leveraged investments, perhaps because they are preferred by
irrational gamblers who are too willing to trade at prices that are far
from true value. These extra hits add more heft to some of my trade-sets,
so they gain more vs. the IWM versions.
For simplicity, I think I will continue to show IWM trades here
until the end of the year, but with confidence that equivalent results to
these paper-trades could realistically be obtained, by
using TNA/TZA in a retirement account.
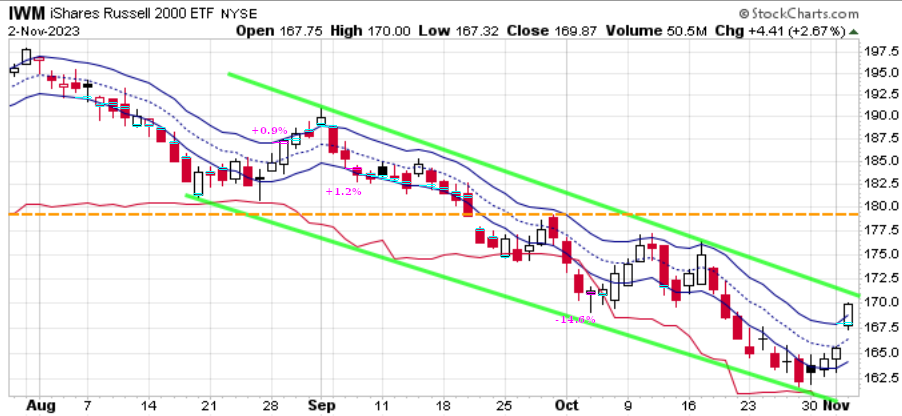
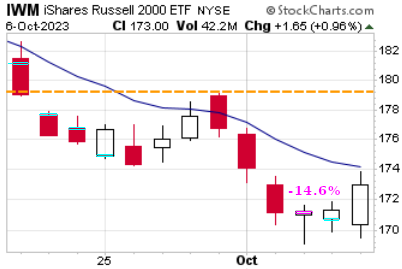
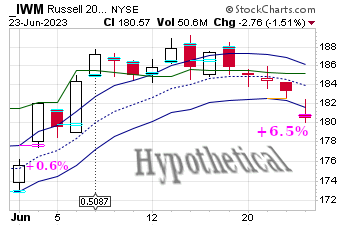
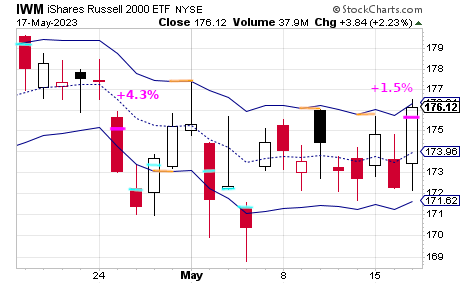
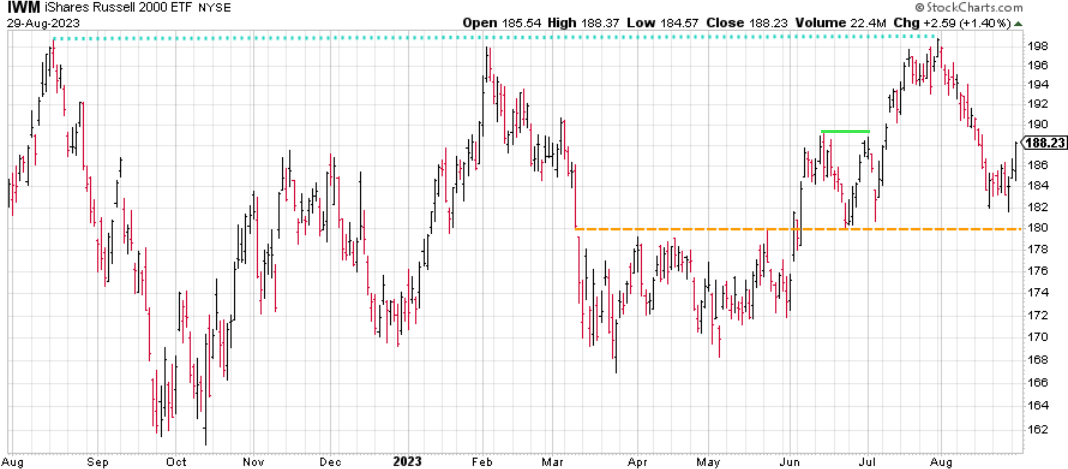 I’ve been watching that dashed orange line since Mar 10 and yammering about
it since Jun 02.
We didn’t bounce off it again this time, but maybe we’ll come back to it
next month. If so, that will create a 4-month-wide
head-and-shoulders
pattern.
I’ve been watching that dashed orange line since Mar 10 and yammering about
it since Jun 02.
We didn’t bounce off it again this time, but maybe we’ll come back to it
next month. If so, that will create a 4-month-wide
head-and-shoulders
pattern.
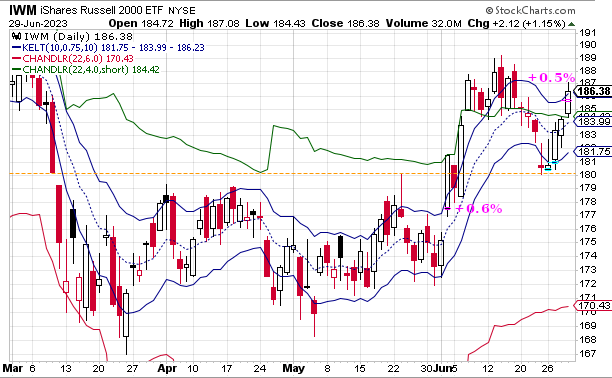
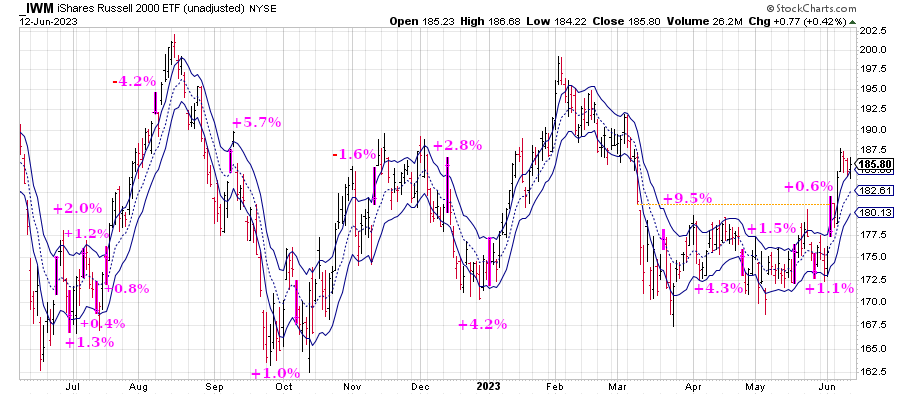
On Jun 29 I wrote,
“For my next trick, I will predict a double-top: price will hit $189.24
around Jul 5 or so. I will not be betting on this prediction.” See solid
green line. It actually got back to $188.84 on Jul 03. That’s 0.2% lower
than I predicted, which is not good enough! Good thing I didn’t bet on
it.
Speaking of double-tops, look at that beautiful dotted-turquoise
line! Nearly a year later and the same price recurred to within a penny —
that’s an error of just 50 ppm! — but only the dividend-adjusted
IWM chart shows this 50-week double-top, which would be a very
bearish sign if other stock funds agreed.
Lawyers: they’re back! Still with nothing to say about the deposition, but
apparently they’ve managed to make contact with my sister in Israel.
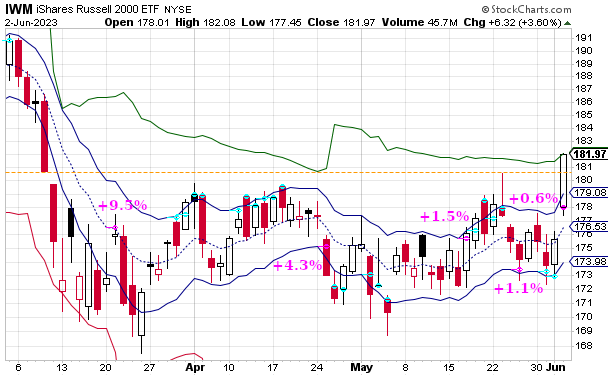
 So, I sold my bullish position on July 29 and then the market tanked
— yay! While it was tanking, I bought more shares on July 31, Aug 01, and
Aug 04, which I then sold on Aug 12 for a profit — yay! I scalped another
+0.8% out of the other traders, even though price just came back to where it
was before.
So, I sold my bullish position on July 29 and then the market tanked
— yay! While it was tanking, I bought more shares on July 31, Aug 01, and
Aug 04, which I then sold on Aug 12 for a profit — yay! I scalped another
+0.8% out of the other traders, even though price just came back to where it
was before.
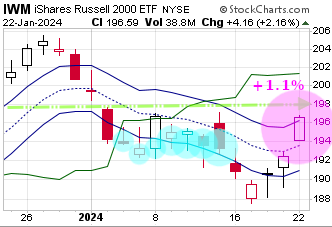

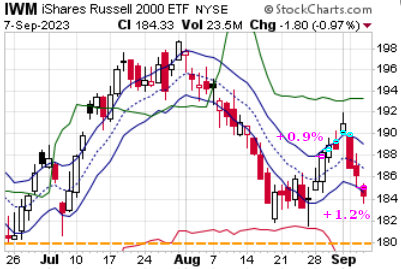
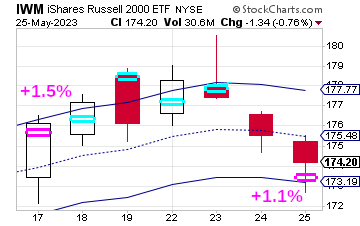
 I am raising my bet to 180% short. While the market heaves up and down, I
keep short-selling at roughly the same price. Hey look, it’s a series of
lower highs — what more of an excuse do you want? And we didn’t
bounce off the upper lime-green line, which is bearish.
I am raising my bet to 180% short. While the market heaves up and down, I
keep short-selling at roughly the same price. Hey look, it’s a series of
lower highs — what more of an excuse do you want? And we didn’t
bounce off the upper lime-green line, which is bearish.


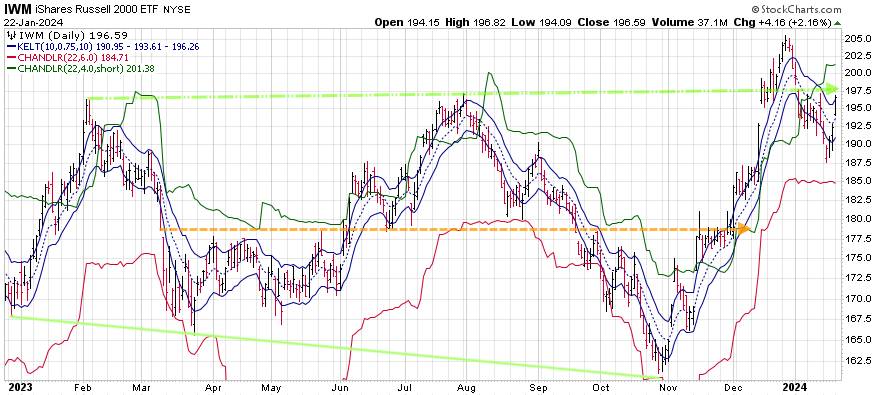
 A lot
of people bought stock at 9:30am Eastern this morning, presumably because
they did their end-of-year portfolio reviews and then entered MARKET BUY
orders over the weekend. Oftentimes these annual investors will pump up the
market for several days at the start of a year — but not this year.
Today’s rally opened strong, banged our gong (upper blue line) within the
first five minutes, then sank into the red for the rest of the day. You
see how important it is to enter your trade orders in advance, just in case
something happens quickly?
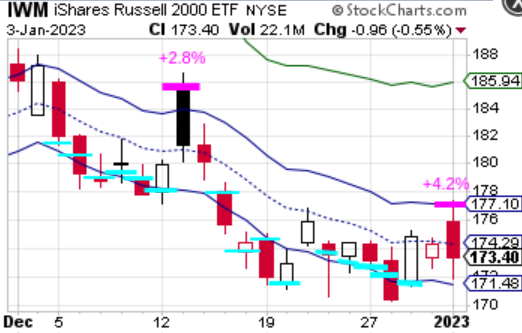
A lot
of people bought stock at 9:30am Eastern this morning, presumably because
they did their end-of-year portfolio reviews and then entered MARKET BUY
orders over the weekend. Oftentimes these annual investors will pump up the
market for several days at the start of a year — but not this year.
Today’s rally opened strong, banged our gong (upper blue line) within the
first five minutes, then sank into the red for the rest of the day. You
see how important it is to enter your trade orders in advance, just in case
something happens quickly?
