Yep, another win
Jun. 29th, 2023 08:37 pm(LiveJournal is talking to me again! Not all past posts have been copied. If you’re using LJ to read this, note that both of the links in this post point to my blog-copy as hosted on DreamWidth.)
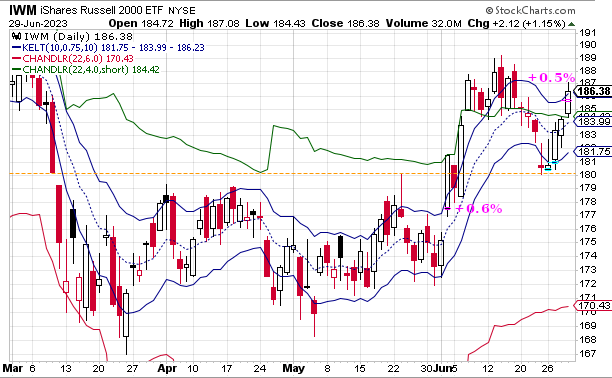
Hi again! Yep, another win. +0.5% this time. Stock-trading is so easy, compared to everything else in my life.
On Jun 02, I exited at the open and then the market sailed higher without me (you get used to that), then I did nothing until Jun 25, when I wrote, “We’ll see if my next imaginary stock-purchase happens tomorrow.” It did. It was a rather short swing, with only two purchase-days, one do-nothing day, and then today’s exit.
Also on Jun 02,
I wrote, “Worst
thing for the bears would be if the market stays up for a couple of days,
then kisses the dashed orange line from the topside, then heads upwards into
the stratosphere. Ow! We could be looking at a June blow-off top to begin
our summer. (The orange line is the gap from when Silicon Valley Bank had
its liquidity crisis…)” This prediction was of course mostly wrong — you’re
watching
For my next trick, I will predict a double-top: price will hit $189.24 around Jul 5 or so. I will not be betting on this prediction.
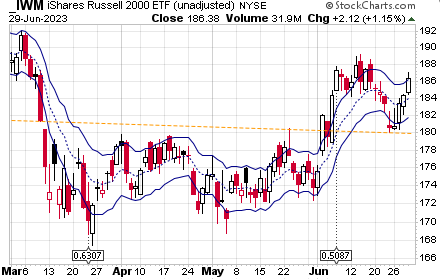
The orange line above looks meaningful. It is horizontal, as we would expect of a line anchored to a gap. The spike-top on May 23 was only 0.05% below the low of Mar 09, while Jun 23’s low was only 0.04% below. Any two of these could be a coincidence, but surely…
Well, actually, the above chart has been ‘adjusted for dividends’ and it does not show the historical prices such as you might have written in your spreadsheet at the time. Instead, it shows what prices would have been had IWM not been a dividend-paying stock. Without that adjustment, the orange line appears slanted on this second chart. I think, if we draw a line from Mar 09 to May 23 and then extend it to Jun 23, then that day’s low was about 0.07% below the line, so still pretty close but way less impressive-looking.
The dividend adjustment formula is utterly standard, has no parameters, and is generally applied by default to charts for all dividend-paying stocks. I didn’t select it to make the orange line pop out in this case — but that’s what it did! So huzzah for the dividend-adjustment thingy.
Tomorrow: no trade orders. I’ve been getting firmer in my belief that I should not buy the first hit on the blue line after a channel-crossing. If there’s no short to cover, then just do nothing that day rather than starting the long series. It’s my impression that oftentimes only that first purchase in the series is unprofitable, so I should just skip that one. Meanwhile, I’m still scared off short-selling by that imaginary arbitrary green line.
Lawyers: nothing. (There’s rather a lot of text in this post, considering how little has happened since last time and that the set of readers is approximately empty.)